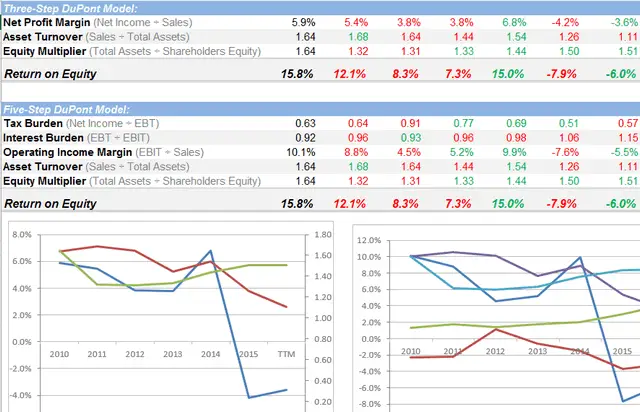
Download 3 free stock calculator spreadsheets following the methods we use for our DCF, Grahams Formula and DuPont Analysis.
Understand the value of a stock as well as a deeper dive into how ROE is calculated.
DOWNLOAD THE SPREADSHEETS
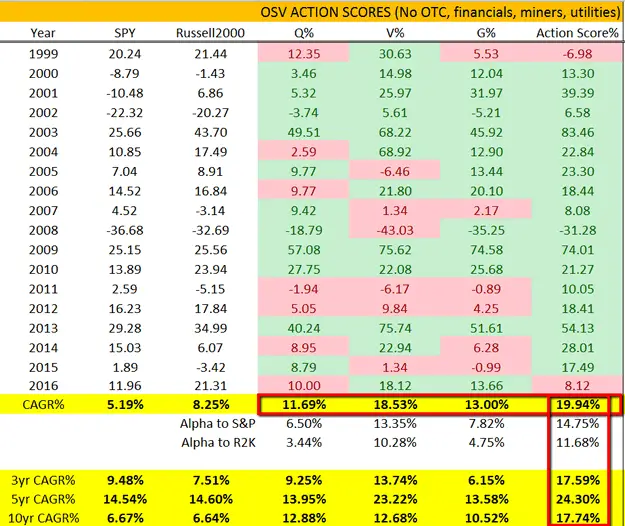
Download a PDF of an independent study performed to validate and evaluate the performance of our Action Score Stock Grading and Valuation tool. Statiscal data with easy to understand explanations on how to interpret the data. See how the stock grading system works and leverage the work to pick winning stocks.
DOWNLOAD THE PAPER
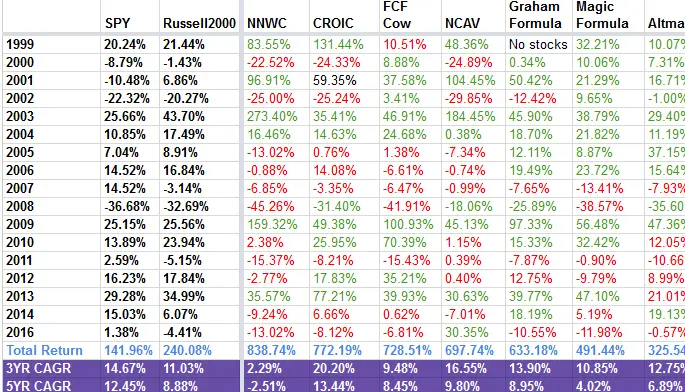
See how you can leverage the Old School Value stock grading and valuation tool to achieve market beating returns to generate a bigger portfolio. We disclose the 2016 performance and disclose how to piggyback our proven scoring and ratings system.
CHECK THE PERFORMANCE
Enjoy our various list of value focused, free pre-defined stock screens.
Based on the ideas of Graham, Buffett, Greenblatt and other strategies.
Updated weekly.
GO TO FREE SCREENERS
A recommended reading list for anyone interested in fundamental analysis and value investing.
Each book is categorized into difficult.
VIEW THE BOOKS NOW
9 value investing blogs that we highly recommend.
Excellent quality with a focus on education.
SEE THE BEST BLOGS
If you are running low on ideas of want to jumpstart your idea brain, check out these sites.
We have collected the best sites that offer quality stock ideas without any sales or being pushy.
SEE STOCK IDEA SITES
From books, to websites, to podcasts, newsletters and more, we list the 60 best investing resources related to value investing you would be crazy to miss.
EXPLORE THE RESOURCES


