The Operating System
for Value Investors.
Streamline your entire research workflow. From idea generation to intrinsic value in minutes, not hours.
Target Price
Margin of Safety
Scan the entire market in seconds.
Find the hidden gems among 40,000+ global equities.
The All-in-One Investment Toolkit
Stop juggling multiple subscriptions. Access a complete suite of institutional-grade valuation models and analysis tools in one platform.
Discounted Cash Flow
The gold standard for intrinsic value. Project future cash flows and discount them back to today using our automated, customizable templates.
Reverse DCF
Invert the logic. Instead of guessing growth, input the current stock price to see exactly what growth rate the market is implying.
Graham Formula
Benjamin Graham's classic formula for valuing stable growth companies, modernized with current bond yields and safety margins.
Earnings Power Value
Value a company based purely on its current distributable cash flow, assuming zero future growth. The ultimate conservative metric.
Fundamental Screener
Filter 40,000+ stocks using 150+ institutional metrics like Piotroski F-Score, Altman Z-Score, CROIC, and WACC.
Excel Add-in
Love your own spreadsheets? Pull our clean historical data and pre-calculated metrics directly into your custom models.
Institutional grade.
Retail simplicity.
We've stripped away the complexity of Bloomberg terminals. Access the same valuation models, simplified for clarity.
Automated Valuation
DCF, Reverse DCF, Graham Formula, and EPV. Pre-built, customizable, and transparent. No black boxes.
Explore ModelsExcel Sync
Pull 40M+ data points directly into Excel.
Deep Screening
Find "Net Net" stocks, high Piotroski scores, and hidden gems.
Visual Financials
Review 10 years of history at a glance. Spot trends, margins, and growth rates without squinting at rows of numbers. We transform complex spreadsheets into intuitive, actionable charts. Dive deep into over 150+ institutional-grade data points to truly understand a company's financial health, cash flow generation, and operational efficiency.
View Analysis FeaturesData behind the value.
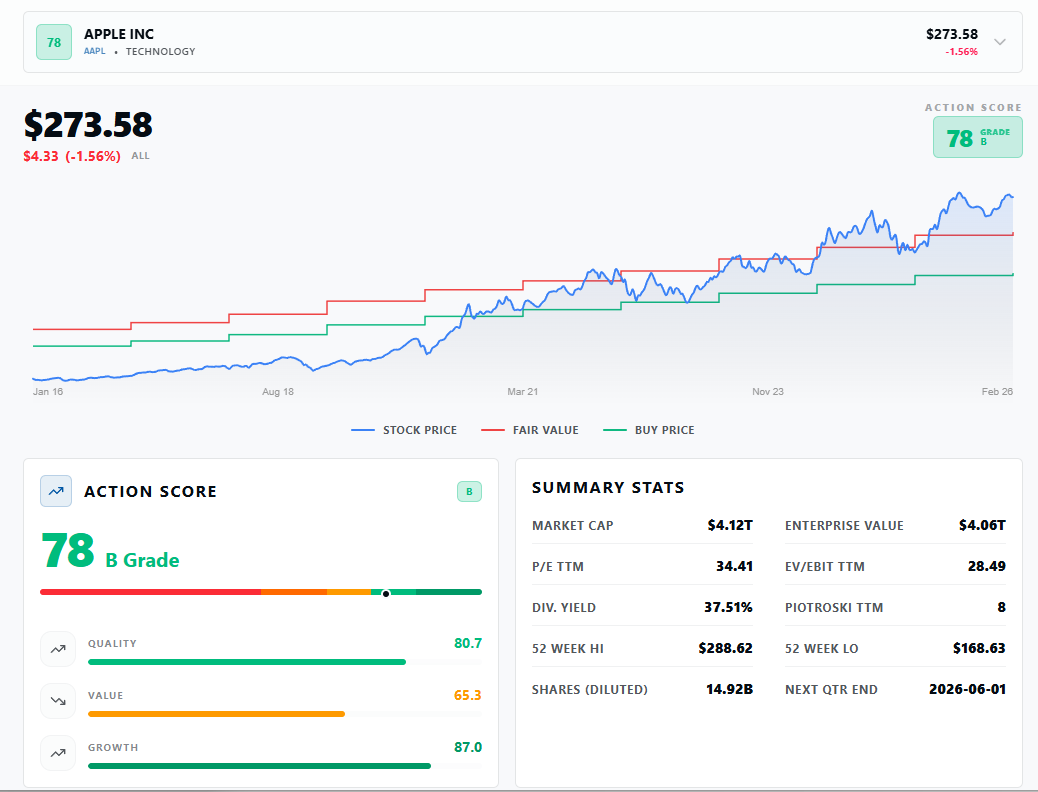
Numbers alone don't tell the story. We combine quantitative rigor with qualitative checks. See the "Story" behind the stock with our new Quality, Value, and Growth ratings.
AI Powered Valuation Analysis New
Instantly synthesize complex financial data into clear, actionable valuation narratives using our proprietary AI engine.
Quality Checks
Automatically flag accounting irregularities, earnings manipulation, and financial distress.
Fair Value Range
Probabilistic valuation ranges based on multiple models, not a single point estimate.
AAPL
NASDAQ · USD
Start Making Better Investment Decisions
Join 50,000+ value investors who use Old School Value to find undervalued stocks, build valuation models, and invest with confidence.
No credit card required. 14-day free trial on Pro plan.