STOCK ANALYSIS RATIOS GUIDE
Mastering Liquidity Ratios
Before a company can grow, it must survive. Learn how to use liquidity ratios to assess a stock's ability to cover its short-term obligations and avoid financial distress.
Can they pay the bills today?
While solvency refers to a company's ability to meet long-term debts, liquidity focuses strictly on the "now." It answers a simple but critical question: Does this company have enough assets to pay off its liabilities due within the next 12 months?
A company can have massive long-term potential, but if it runs out of cash to pay suppliers or service debt next month, the stock can go to zero. Liquidity ratios act as your early warning system for financial distress.
- Identify companies with strong balance sheets
- Avoid potential bankruptcies or dilution events
- Spot inefficient capital allocation
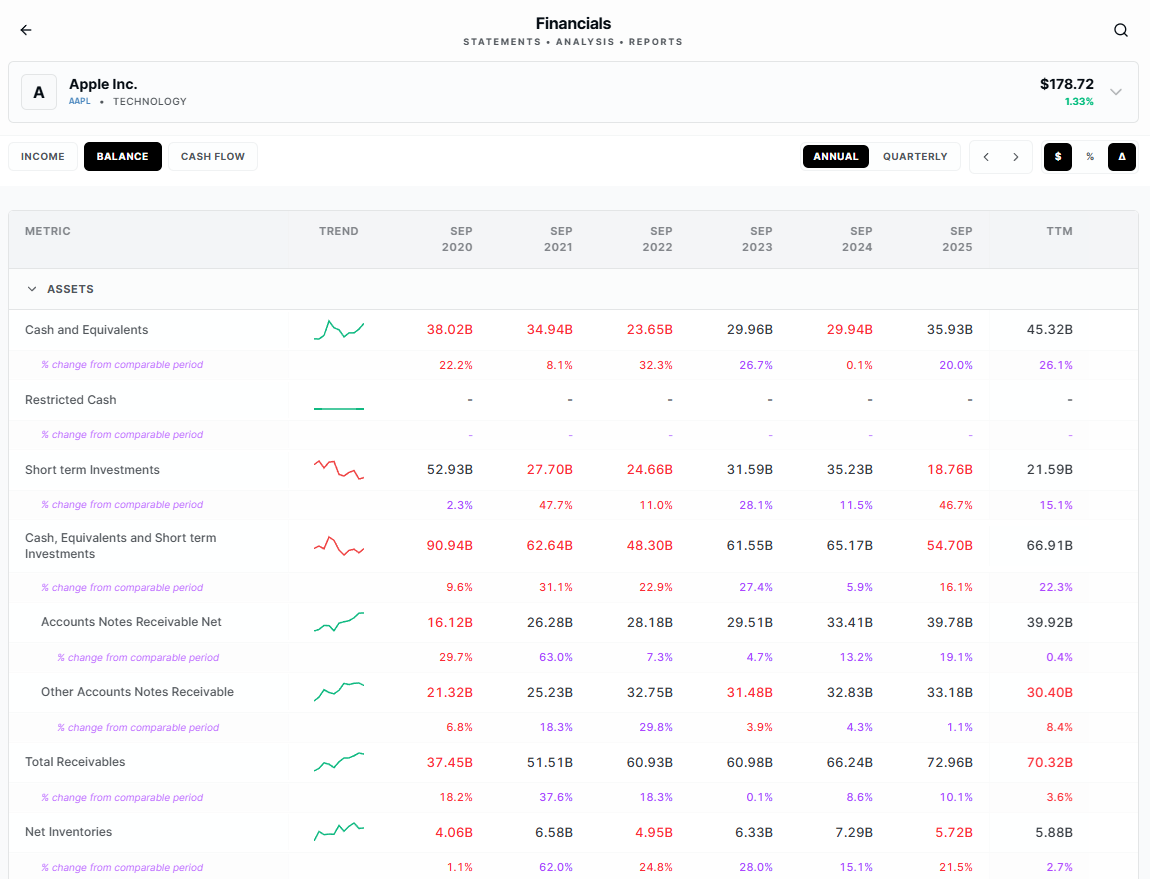
The Hierarchy of Liquidity
Moving from the broadest measure to the most conservative test of cash.
1. Current Ratio
Current Assets / Current Liabilities
The simplest measure. It assumes all current assets (including inventory and receivables) can be liquidated to pay debts. A ratio under 1.0 indicates potential trouble.
Gives a broad overview of working capital.
2. Quick Ratio
(Assets - Inventory) / Liabilities
Also known as the "Acid Test." It removes inventory from the equation because inventory can be hard to sell quickly during a crisis.
More realistic for retailers or manufacturers.
3. Cash Ratio
Cash & Equiv. / Liabilities
The most conservative measure. It asks: "If the company sold nothing else effectively immediately, could it pay its bills with just the cash in the bank?"
The ultimate safety check for distress.
Context is Everything
A high ratio isn't always good. A Current Ratio of 5.0 might mean the company is hoarding cash and not investing in growth. A low ratio isn't always bad—Walmart operates efficiently with a low ratio because they turn inventory over so fast.
The Golden Rule: Always compare ratios against direct competitors in the same industry.
Start a Peer ComparisonPeer Analysis: Retail Sector
Live Data Mockup| Company | Current Ratio | Quick Ratio | Cash Ratio | Verdict |
|---|---|---|---|---|
| Target Corp (TGT) | 0.98 | 0.25 | 0.15 | Efficient |
| Costco (COST) | 1.02 | 0.52 | 0.48 | Strong |
| Distressed Retailer X | 0.45 | 0.10 | 0.02 | Risk |
*Example data. Retailers typically run lower ratios due to high inventory turnover.
Don't Calculate by Hand
Get Current, Quick, and Cash ratios instantly calculated for 40,000+ stocks. Screen for financially sound companies in seconds.
Free for the first 14 days. No credit card required.