OSV Rating System
Old School Value
Stock Rating System.
A quick way to start your research and simplify your fundamental analysis. Discover value stocks using our clear scoring system that covers all the necessary financial factors, broken down into simple A-to-F grades.
No credit card required. 14-day free trial.
AI-Powered Valuation Report & Score
Go beyond the numbers with our new Qualitative Score. We've integrated advanced AI to analyze the qualitative aspects of a business, giving you a complete picture of a company's true value for your stock portfolio.
The AI Value Report seamlessly combines business fundamentals, accurate valuation models, long-term outlook assessments, and deep profitability analysis into one easy-to-read stock rating.
Learn MoreBusiness Fundamentals
Deep dive into core operations, competitive moats, and overall financial health.
Valuation
Accurate fair value estimates leveraging multiple battle-tested rating models.
Long-Term Outlook
AI-driven analysis of future growth potential and industry tailwinds.
Profitability
Evaluation of margin trends, ROIC, and capital allocation efficiency.
OSV Action Score
The OSV Action Score is based on the Quality, Value, and Growth principle. The Action Score is an average of the three other core OSV rating scores. A high score means a stock is worth "taking action."
The purpose is to allow our stock grading system to do all the heavy lifting of finding value stocks for you. Instead of wading through an ocean of equities before you find one worth investigating, the OSV Action Score system filters out the bad stuff and presents you with quality, actionable ideas right away.
1
OSV Quality Score
Evaluate the true strength of a business by analyzing its cash generation, competitive moat, and management effectiveness.
Jump to Quality Score2
OSV Value Score
Discover undervalued stock opportunities hidden in plain sight by focusing on the most reliable valuation multiples.
Jump to Value Score3
OSV Growth Score
Identify companies with true top-line momentum by evaluating a blend of short and long-term expansion metrics.
Jump to Growth ScoreOSV Value Score
Discover undervalued stocks hidden in plain sight. Our Value Score identifies companies trading at a discount to their intrinsic value by focusing on the most reliable valuation multiples used by top value investors.
We prioritize real cash generation with the heaviest weighting placed on Price to Free Cash Flow (P/FCF). This is supported by EV/EBIT for a capital-structure-neutral view, and Price to Book Value to measure asset-based value.
- Heavily weighted towards actual cash generation
- Neutralizes varying debt and cash levels
- Avoids easily manipulated earnings metrics
Price to Free Cash Flow
Our heaviest-weighted metric, focusing purely on the actual cash a business generates relative to its current market price.
Enterprise Value / EBIT
Evaluates the entire enterprise value against core operating earnings, neutralizing differences in capital structure and tax rates.
Price to Book Value
Compares the market valuation to the company's net asset value to help uncover deeply discounted, asset-rich stocks.
OSV Quality Score
Numbers alone don't tell the whole story. Our Quality Score evaluates the true strength of a business by analyzing its cash generation, competitive moat, and management effectiveness.
Cash Generation & Effectiveness
Finds companies converting a high percentage of sales into Free Cash Flow, demonstrating management effectiveness with a strong cash return on invested capital (CROIC).
Competitive Moat & Accounting
Ensures a durable competitive advantage and utilizes a high Piotroski Score to demonstrate quality accounting principles.
QUALITY
SCORECARD
Sales Percent Change
Tracks recent top-line revenue expansion to identify immediate short-term momentum.
5-Yr Compound Annual Growth
Evaluates long-term, sustained sales performance over a five-year horizon.
Gross Profit to Assets
Measures raw profitability relative to the asset base, independent of capital structure.
OSV Growth Score
Identify companies with true top-line momentum. Our Growth Score accurately measures sales growth momentum by evaluating a blend of short and long-term expansion metrics.
We look beyond simple year-over-year figures, incorporating important factors like Sales percent change, 5-year compound annual growth rates (CAGR), and Gross Profit to Assets to ensure the growth you're seeing is both sustainable and efficient.
- Spot accelerating revenue trends early
- Filter out unsustainable, one-off spikes
- Focus on highly profitable asset growth
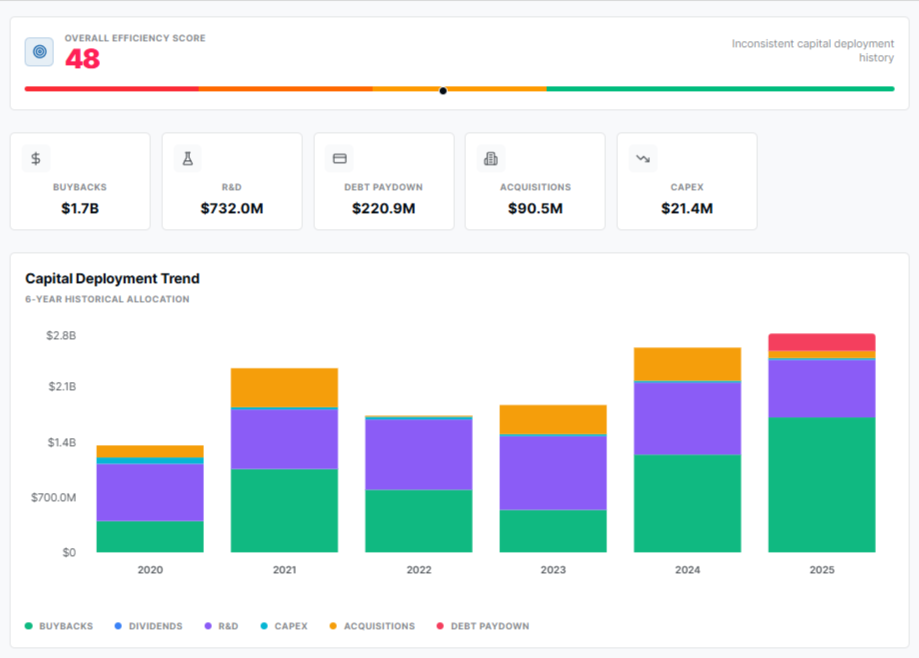
OSV Capital Efficiency Score
Evaluate how effectively management deploys capital to generate returns. Our Capital Efficiency Score analyzes major allocation decisions to ensure shareholder funds are used appropriately to fuel sustainable growth.
-
Internal Reinvestment
- Measures the impact and efficiency of major capital allocation decisions like R&D spending and capital expenditures.
-
Shareholder Returns
- Factors in management's track record of issuing dividends, executing stock buybacks, and paying down corporate debt.
-
Strategic Acquisitions
- Looks at the company's historical acquisitions to ensure they successfully fuel growth and use shareholder funds appropriately.
Start Making Better Investment Decisions
Join 50,000+ value investors who use our stock rating system to find undervalued stocks, build valuation models, and invest with confidence.
No credit card required. 14-day free trial on Pro plan.