Mastering Price Multiples
A step-by-step guide to relative valuation. Learn how to use P/E, P/S, and Enterprise Value multiples to find undervalued stocks by comparing them against their peers.
The Art of Peer Comparison
Valuation is rarely absolute. To know if a stock is "cheap" or "expensive," you must compare it to something else. This is called Relative Valuation.
How to Compare
Investors compare a company's valuation multiples (like P/E or EV/EBITDA) against:
- Direct Competitors: Companies of similar size in the same industry.
- Industry Averages: The median multiple for the entire sector.
- Historical Averages: The company's own 5-year or 10-year average multiple.
The Goal: Find high-quality companies trading at multiples lower than their peers or their own history.
Price to Earnings (P/E)
The P/E ratio is the most widely used valuation metric. It simply measures how much you are paying for $1 of the company's earnings.
When to use it
Best for mature, stable companies with consistent profitability.
Watch out for
Earnings can be manipulated by accounting tricks. One-time gains can artificially lower P/E.
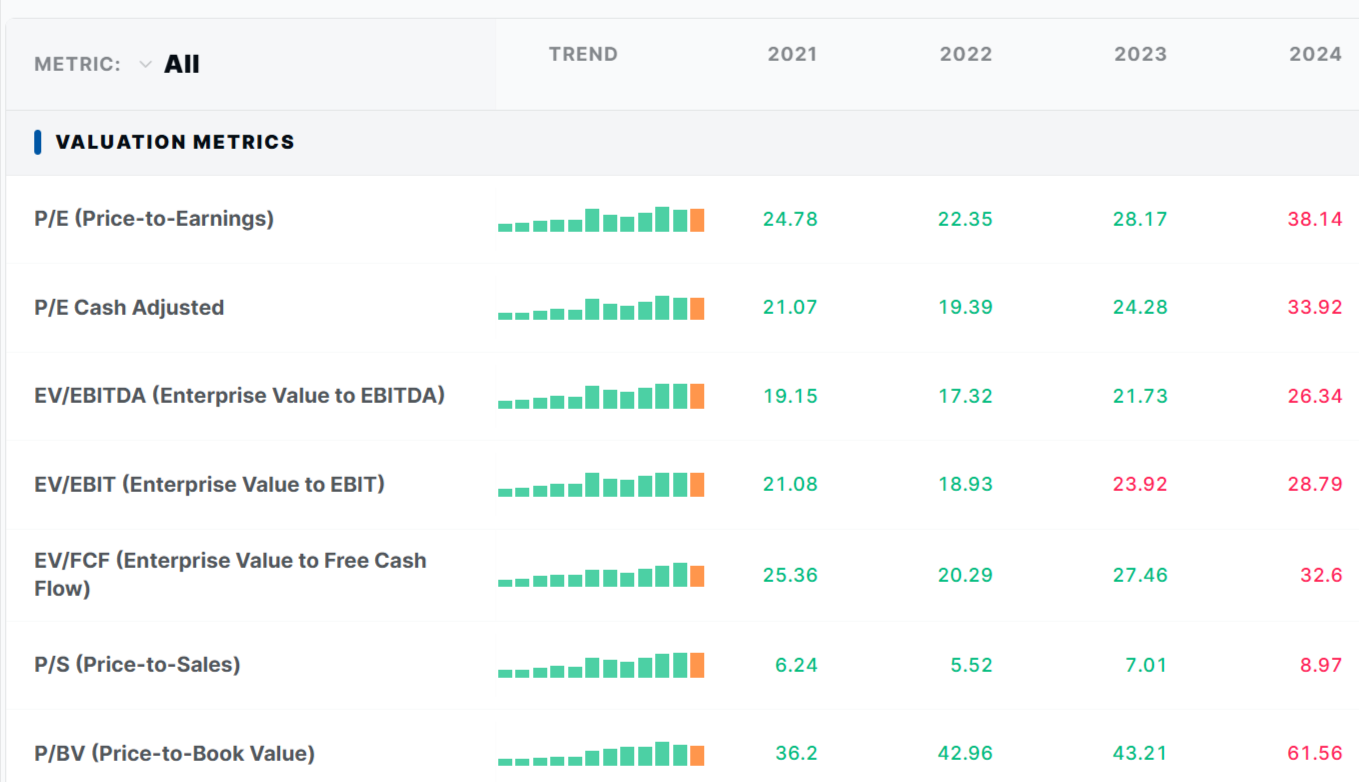
Price to Sales (P/S)
When a company isn't profitable yet, P/E is useless. Enter the Price-to-Sales ratio. It values a company based on its revenue, which is harder to manipulate than earnings.
When to use it
Ideal for high-growth tech stocks, startups, or cyclical companies in a downturn.
The Caveat
Sales don't pay the bills—profits do. A low P/S means nothing if margins are permanently low.
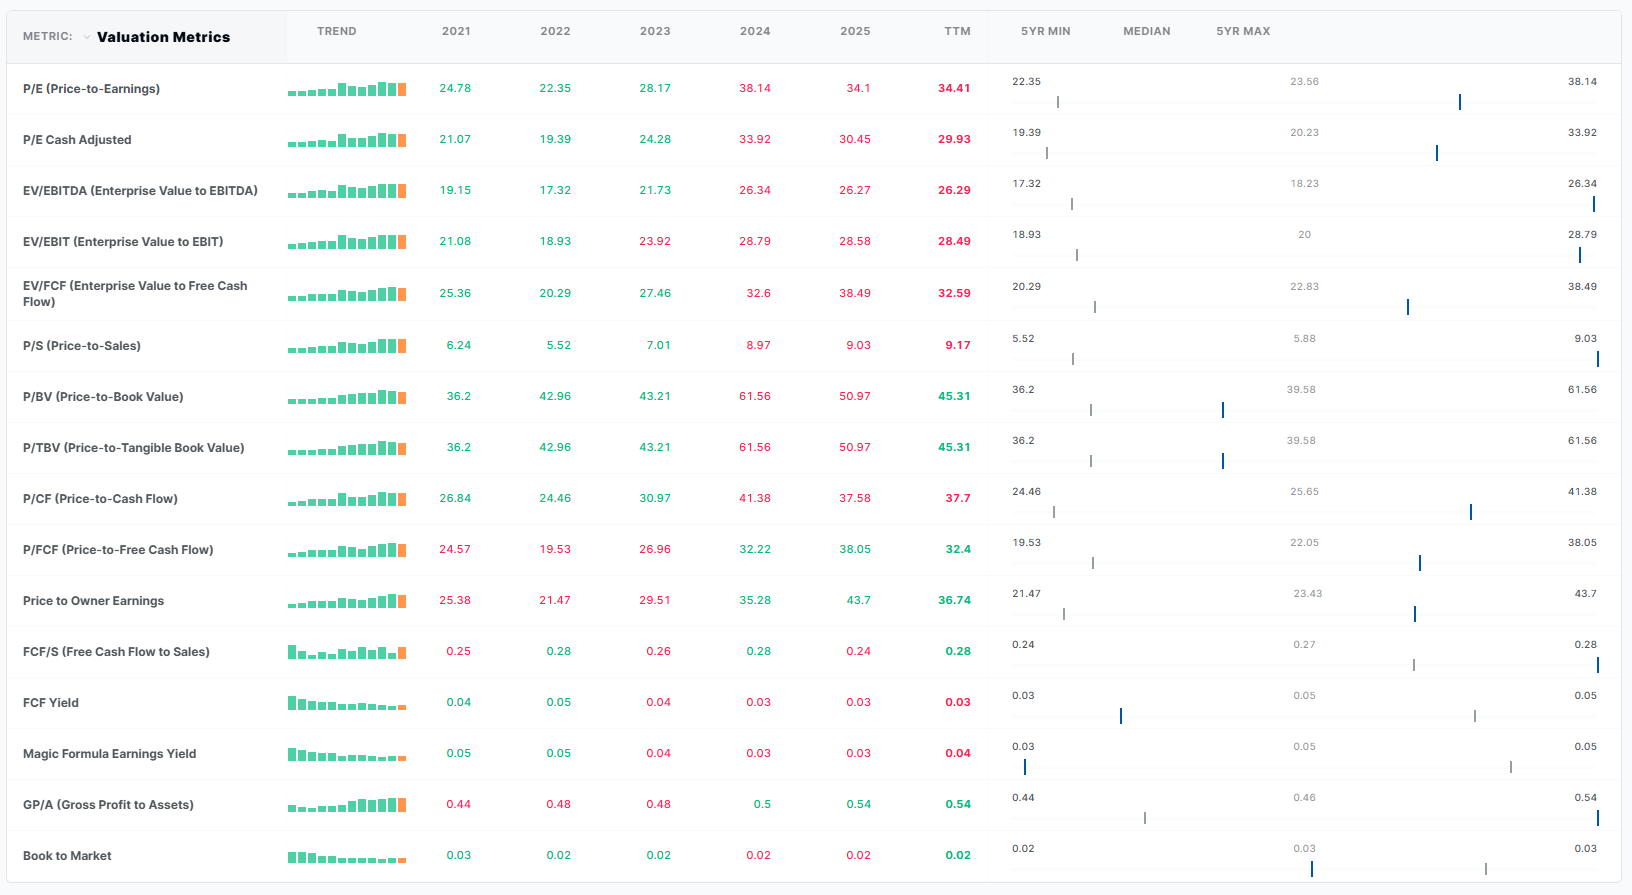
Price to Free Cash Flow (P/FCF)
"Earnings are opinion, cash is fact." Free Cash Flow represents the actual cash generated that can be returned to shareholders. P/FCF is widely considered the premier valuation metric by value investors.
Why it's superior
It accounts for capital expenditures (CapEx) needed to maintain the business, unlike P/E.
EV / EBIT Multiple
Now we step into Enterprise Value (EV) multiples. EV/EBIT allows you to compare companies with different debt levels and tax rates on an apples-to-apples basis.
The "Acquirer's Multiple"
It measures operating earnings yield relative to the total cost to buy the entire company (equity + debt).
EV / EBITDA
EBITDA adds back Depreciation and Amortization to EBIT. This metric is a proxy for raw operating cash flow before heavy machinery or intangible assets are paid for.
Heavy Industry Standard
Commonly used for capital-intensive industries (telecom, utilities) to compare operating efficiency without the noise of depreciation schedules.
Ready to Value Stocks Like a Pro?
Get instant access to all these valuation multiples for thousands of stocks. Save hours of calculation time and focus on finding the best investments.