Stock Analysis Ratios
Master the financial metrics that matter. Learn how to evaluate profitability, liquidity, efficiency, and quality to find undervalued stocks and build a market-beating portfolio.
Financial ratios are the language of business. By translating complex financial statements into standardized metrics, investors can quickly compare companies across industries, spot hidden red flags, and identify deeply undervalued opportunities. Explore our comprehensive guides below to master the four pillars of fundamental analysis.
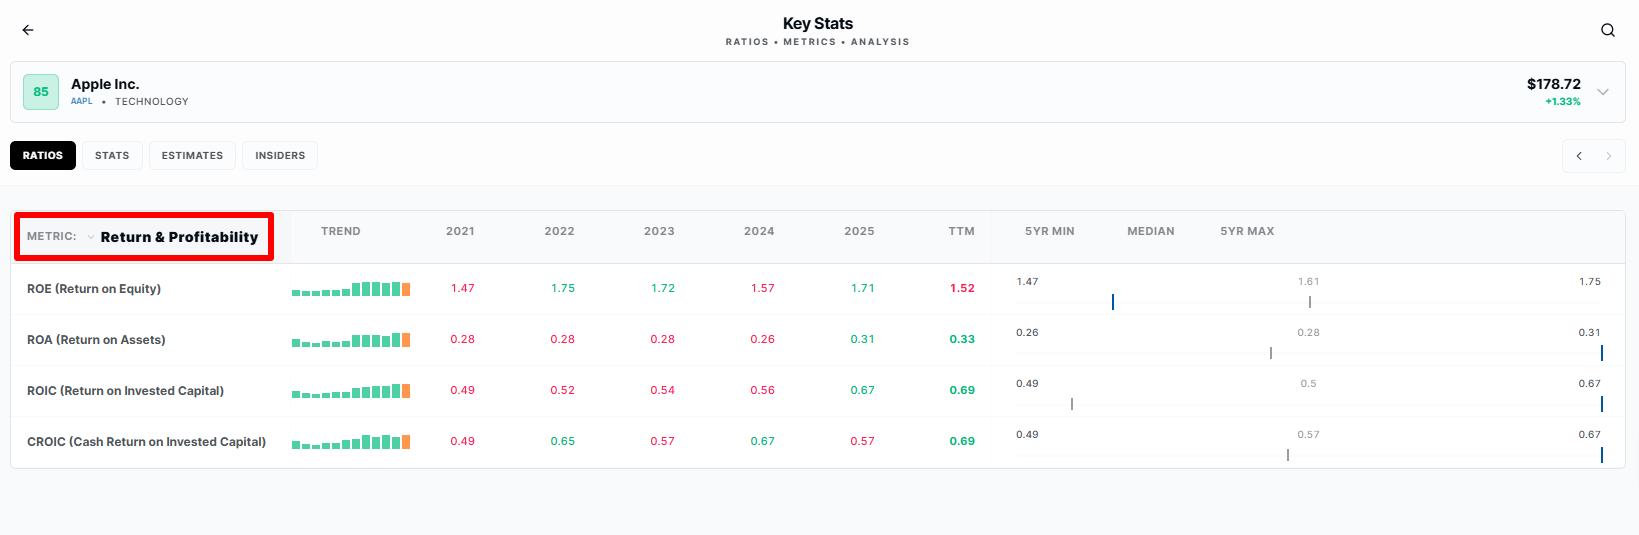
Profitability Ratios
Profitability ratios measure a company's ability to generate income relative to its revenue, balance sheet assets, or shareholders' equity. These are arguably the most popular metrics among investors, as they directly reflect a company's bottom-line success and competitive advantage.
- Return on Equity (ROE): Measures how effectively management uses shareholders' capital to generate profits.
- Gross Margin: Reveals the underlying economics, production efficiency, and pricing power of the business.
- ROIC: The ultimate test of capital allocation and economic moat durability over the long term.
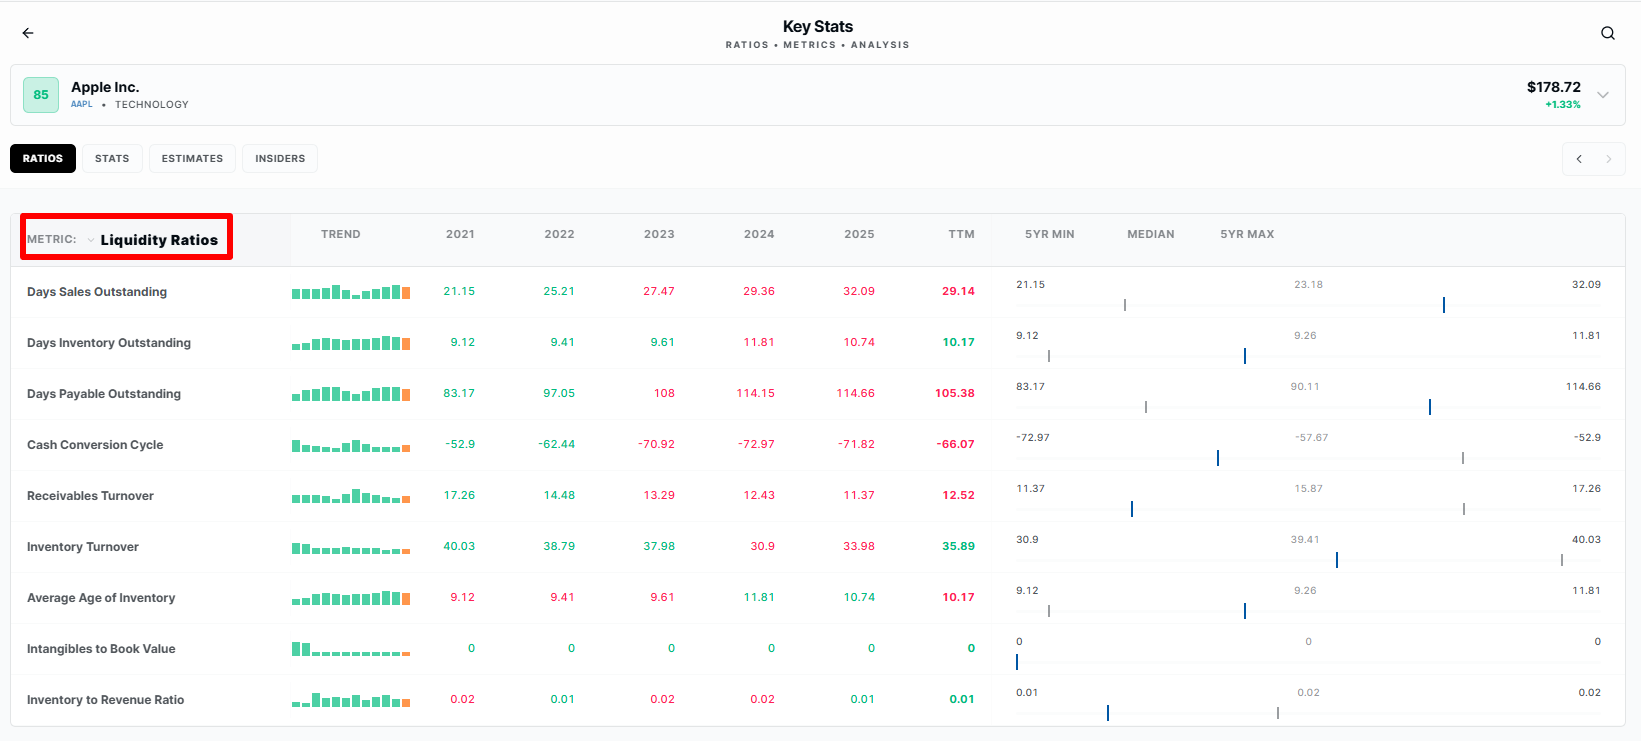
Liquidity Ratios
Survival comes before success. Liquidity ratios evaluate a company's ability to meet its short-term debt obligations without raising external capital. In times of economic stress, strong liquidity is what separates resilient survivors from bankruptcies.
- Current Ratio: The classic measure comparing short-term assets against short-term liabilities.
- Quick Ratio: A stricter test of liquidity that strips out illiquid inventory from the calculation.
- Cash Ratio: The most conservative metric, measuring absolute safety using only cash and equivalents.
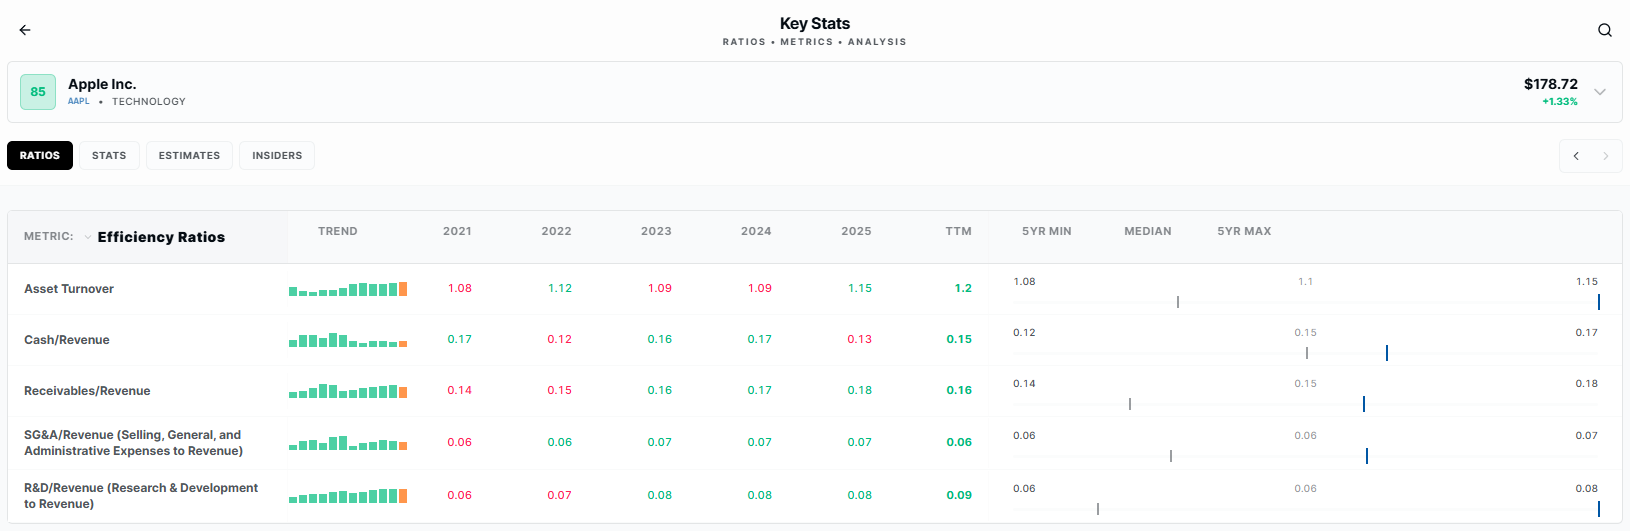
Efficiency Ratios
Efficiency ratios (often called activity ratios) analyze how well a company utilizes its assets and manages its liabilities to generate sales. High efficiency usually points to superior management and a strong operational position within the industry.
- Asset Turnover: Calculates how many dollars of revenue are generated for every dollar of assets.
- Inventory Turnover: Crucial for retail and manufacturing sectors to spot stagnant or obsolete goods.
- Days Sales Outstanding: Measures exactly how quickly a company collects actual cash from its credit customers.
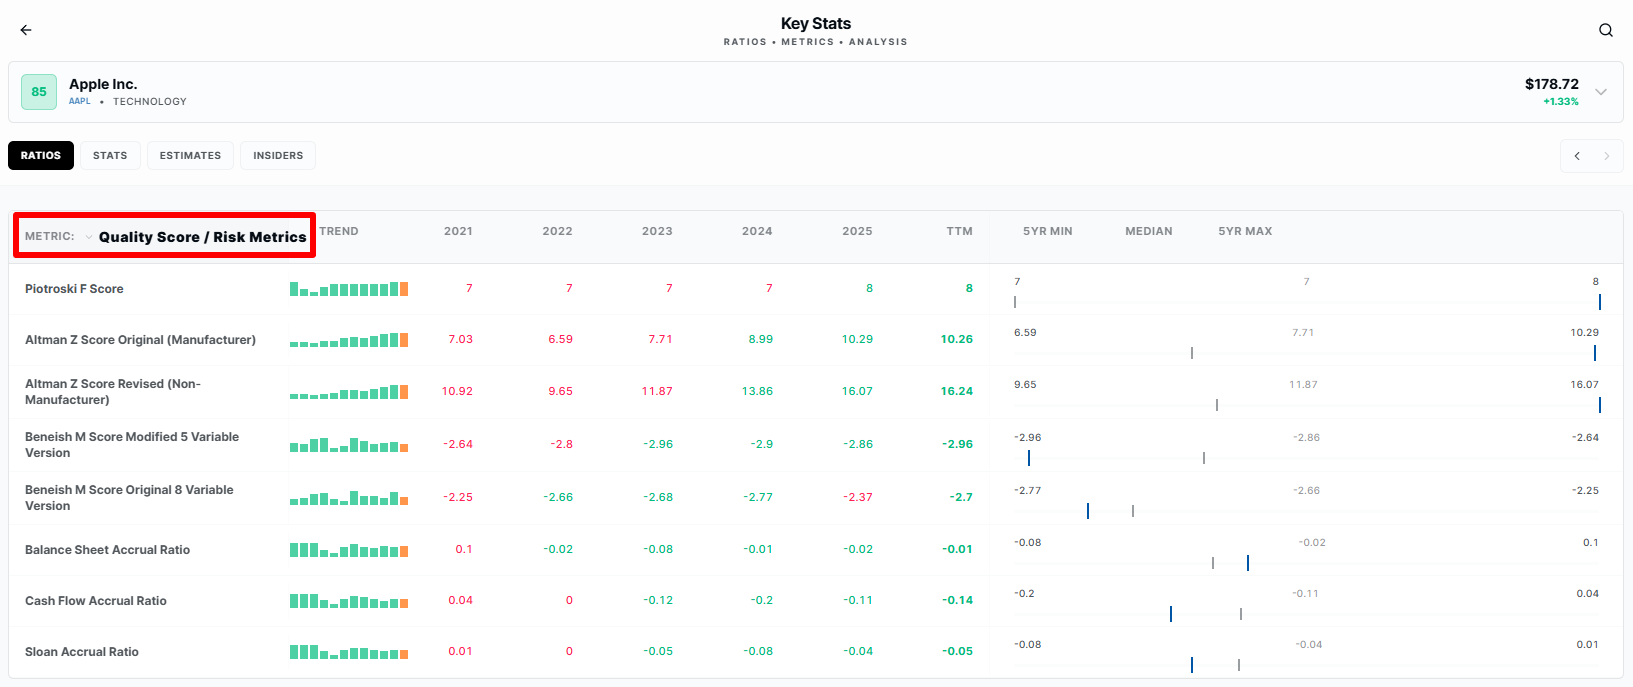
Quality Ratios
Not all earnings are created equal. Quality ratios dig deeper into the financial statements to uncover accounting red flags, measure the true cash-generating power of the business, and assess the risk of financial manipulation.
- Piotroski F-Score: A rigorous 9-point scale that identifies the healthiest, highest-quality value stocks.
- Altman Z-Score: The industry-standard formula used for decades to predict bankruptcy risk.
- Earnings Quality: Compares reported net income to actual free cash flow to detect aggressive accounting.
Stop Calculating. Start Investing.
Get instant access to pre-calculated profitability, liquidity, efficiency, and quality ratios for over 40,000 stocks. Create your Old School Value account today and streamline your research.
Full access to all stock analysis ratios. No commitment required.