Stock Analysis Ratios Guide
Mastering Profitability Ratios
Discover how to measure a company's true earning power. We guide you from simple margins to advanced capital efficiency metrics like ROIC and CROIC.
Why Profitability Matters
Profitability ratios are the financial metrics used to assess a business's ability to generate earnings relative to its revenue, operating costs, balance sheet assets, or shareholders' equity over time.
For value investors, these numbers are the pulse of the company. However, a single number in isolation is meaningless. To find true undervalued gems, you must compare these figures among industry peers and track them over historical periods to spot trends.
Level 1: The Margins
The fundamental layers of profit from top to bottom.
Gross Margin
Gross Profit / Revenue
Indicates pricing power and production efficiency. High gross margins often signal a durable competitive advantage (moat).
Operating Margin
Operating Income / Revenue
Shows how much is left after paying for variable costs like wages and raw materials. This represents the core business profitability.
Net Margin
Net Income / Revenue
The "bottom line." While important, it can be noisy due to one-time events, taxes, and interest payments.
Level 2: Management Effectiveness
Moving beyond simple margins, we look at how well management uses the capital entrusted to them.
Return on Equity (ROE)
Measures the return generated on shareholders' equity. A classic metric, but be careful—high debt can artificially inflate ROE.
Return on Assets (ROA)
Shows how efficient management is at using its assets to generate earnings. Crucial for asset-heavy industries like manufacturing.
The Debt Trap Warning
Why prefer ROA over ROE sometimes?
Companies with massive debt can show sky-high ROE because their Equity denominator is small. Always check ROA or ROIC to verify.
Level 3: The Holy Grail
For the advanced investor, standard metrics aren't enough. We calculate capital allocation efficiency to find compounders.
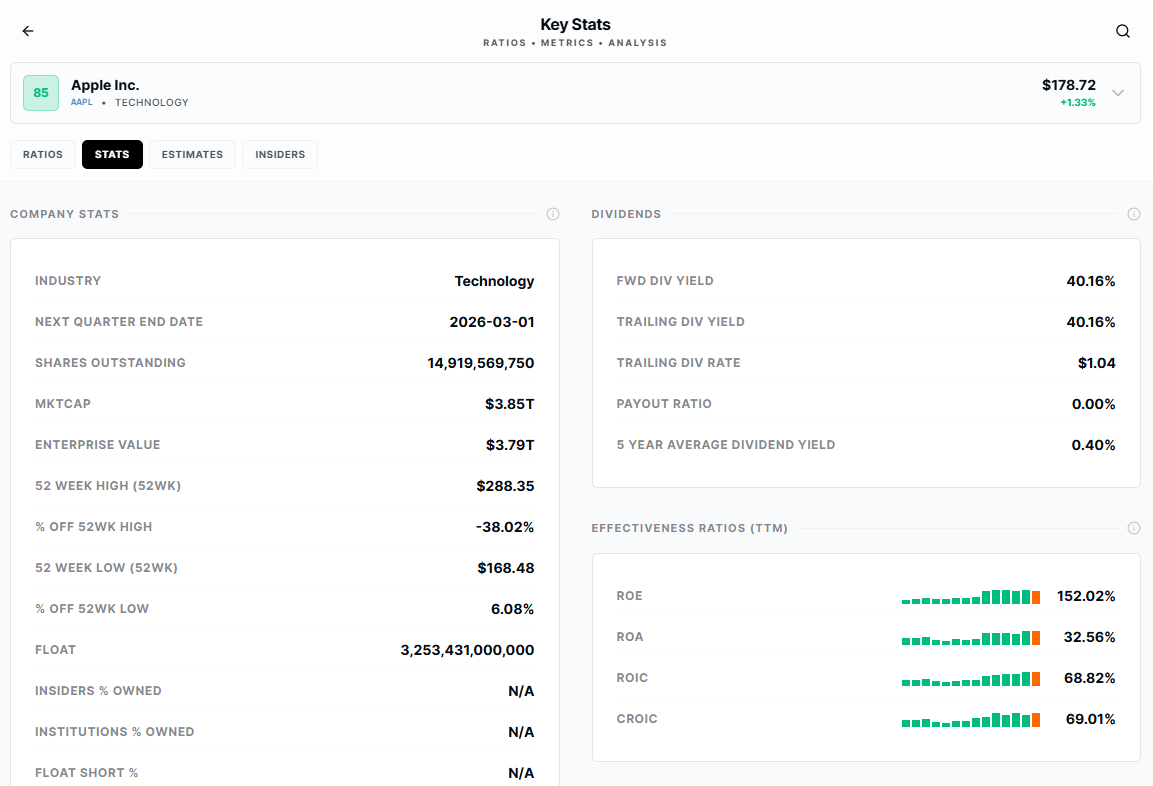
ROIC (Return on Invested Capital)
The ultimate measure of a moat. It calculates the return on ALL capital invested in the business (Equity + Debt). High ROIC companies compound wealth over time.
CROIC (Cash Return on Invested Capital)
An Old School Value specialty. We replace "Earnings" with "Free Cash Flow." It tells you how much actual cash the business generates for every dollar invested.
Peer Comparison Analysis
Context is everything. See how different business models compare using these ratios. A "good" number depends entirely on the industry.
| Company | Gross Margin | Oper. Margin | ROE | ROIC | CROIC |
|---|---|---|---|---|---|
|
AAPL Apple Inc.
|
45.0% | 30.7% | 160.0% | 58.2% | 48.5% |
|
COST Costco
|
12.3% | 3.4% | 28.5% | 18.1% | 15.2% |
|
F Ford Motor
|
10.1% | 4.2% | 12.1% | 3.5% | -1.2% |
Example data for educational purposes. Notice how high-margin tech (Apple) differs structurally from high-volume retail (Costco) and capital-intensive auto (Ford).
Analyze Profitability in Seconds
Stop calculating ratios manually. Old School Value provides 20 years of pre-calculated financial data, including ROIC and CROIC, for 40,000+ stocks.
No credit card required. 14-day free trial on Pro plan.