How to Use the Cash Conversion Cycle to Analyze Stocks

What You’ll Learn
- What type of deep insight you gain by analyzing cash conversion cycles
- How to interpret and compare the CCC ratio
- The effect of negative cash conversion cycle
What is the Cash Conversion Cycle?
The main way a company can make more profit is to simply sell more stuff. But how do you sell more stuff?
Cash.
More cash availability equals more products you can make and sell.
Wall Street loves earnings and many people believe earnings drives cash and profitability, but this is incorrect. Cash drives earnings. The faster the cycle of cash, the quicker it can be reinvested to generate earnings.
Regardless of what the media says, cash is and always will be king. No business can start or grow without cash. That’s why growth and start up companies are constantly looking to raise cash.
By looking at the cash conversion cycle and analyzing the CCC formula, a company that can shorten the cash conversion cycle is going to be ahead of its competitors.
The basic theory of the cash conversion cycle is this:
- you start with cash
- it becomes accounts payables as you buy inventory from a supplier
- you receive the inventory
- the inventory is then sold and becomes accounts receivables
- when accounts receivables is collected, you have cash again and you restart the cycle from step 1
The Cash Conversion Cycle
The entire cash conversion cycle is a measure of operating efficiency and management effectiveness. The lower the number, the quicker the cycle. The quicker the cash conversions cycle, the better the management is at operating the business.
In this way, you can use the cash conversion cycle formula to compare efficiency and management on an apples to apples basis. In other words, do not use the Cash Conversion Cycle to compare companies from different industries or different business models.
How to Calculate the Cash Conversion Cycle Formula
The CCC ratio is made up of 3 components.
- Days Inventory Outstanding (DIO)
- Days Sales Outstanding (DSO)
- Days Payables Outstanding (DPO)
The final formula you’ll be using is
Days Inventory Outstanding
+ Days Sales Outstanding
– Days Payables Outstanding
There is a common misunderstanding that the Cash Conversion Cycle comes from the balance sheet. The CCC equation requires both the income statement and the balance sheet. As the cycle involves the selling of inventory, this is entered into the financials as revenue.
Let’s break down each component and you’ll see how it all works.
Days Inventory Outstanding
Days Inventory Outstanding shows you in days, how long it takes for inventory to be sold. The quicker inventory is sold, the better.
This is an annual calculation. To calculate between two periods, use the below formula.
DIO = Average inventory/COGS x number of days in period
Average Inventory = (beginning inventory + ending inventory)/2
Days Sales Outstanding
Days Sales Outstanding is the number of days it takes for a company to collect money from sales and involves accounts receivables. Obviously, a low number is better.
DSO = (Accounts Receivables/Revenue) x 365
This is an annual calculation. To calculate between two periods, use the below formula.
DSO = Average AR ÷ Revenue x number of days in period
Average AR= (beginning AR + ending AR)/2
Days Payables Outstanding
Days Payables Outstanding represents how many days before the company pays it off. The higher the number, the better, because that means the company can use that cash for other profitable purposes before making payments.
DPO = (Accounts Payable/COGS) x 365
This is an annual calculation. To calculate between two periods, use the below formula.
DPO = Average AP ÷ COGS per day
Average AP = (beginning AP + ending AP)/2
Comparing Cash Conversion Cycle of Retailers
The best way to use the Cash Conversion Cycle is to compare competitors from within the same industry with essentially the same business model.
Let’s look at Costco (COST), Walmart (WMT), Target (TGT) and Big Lots (BIG).
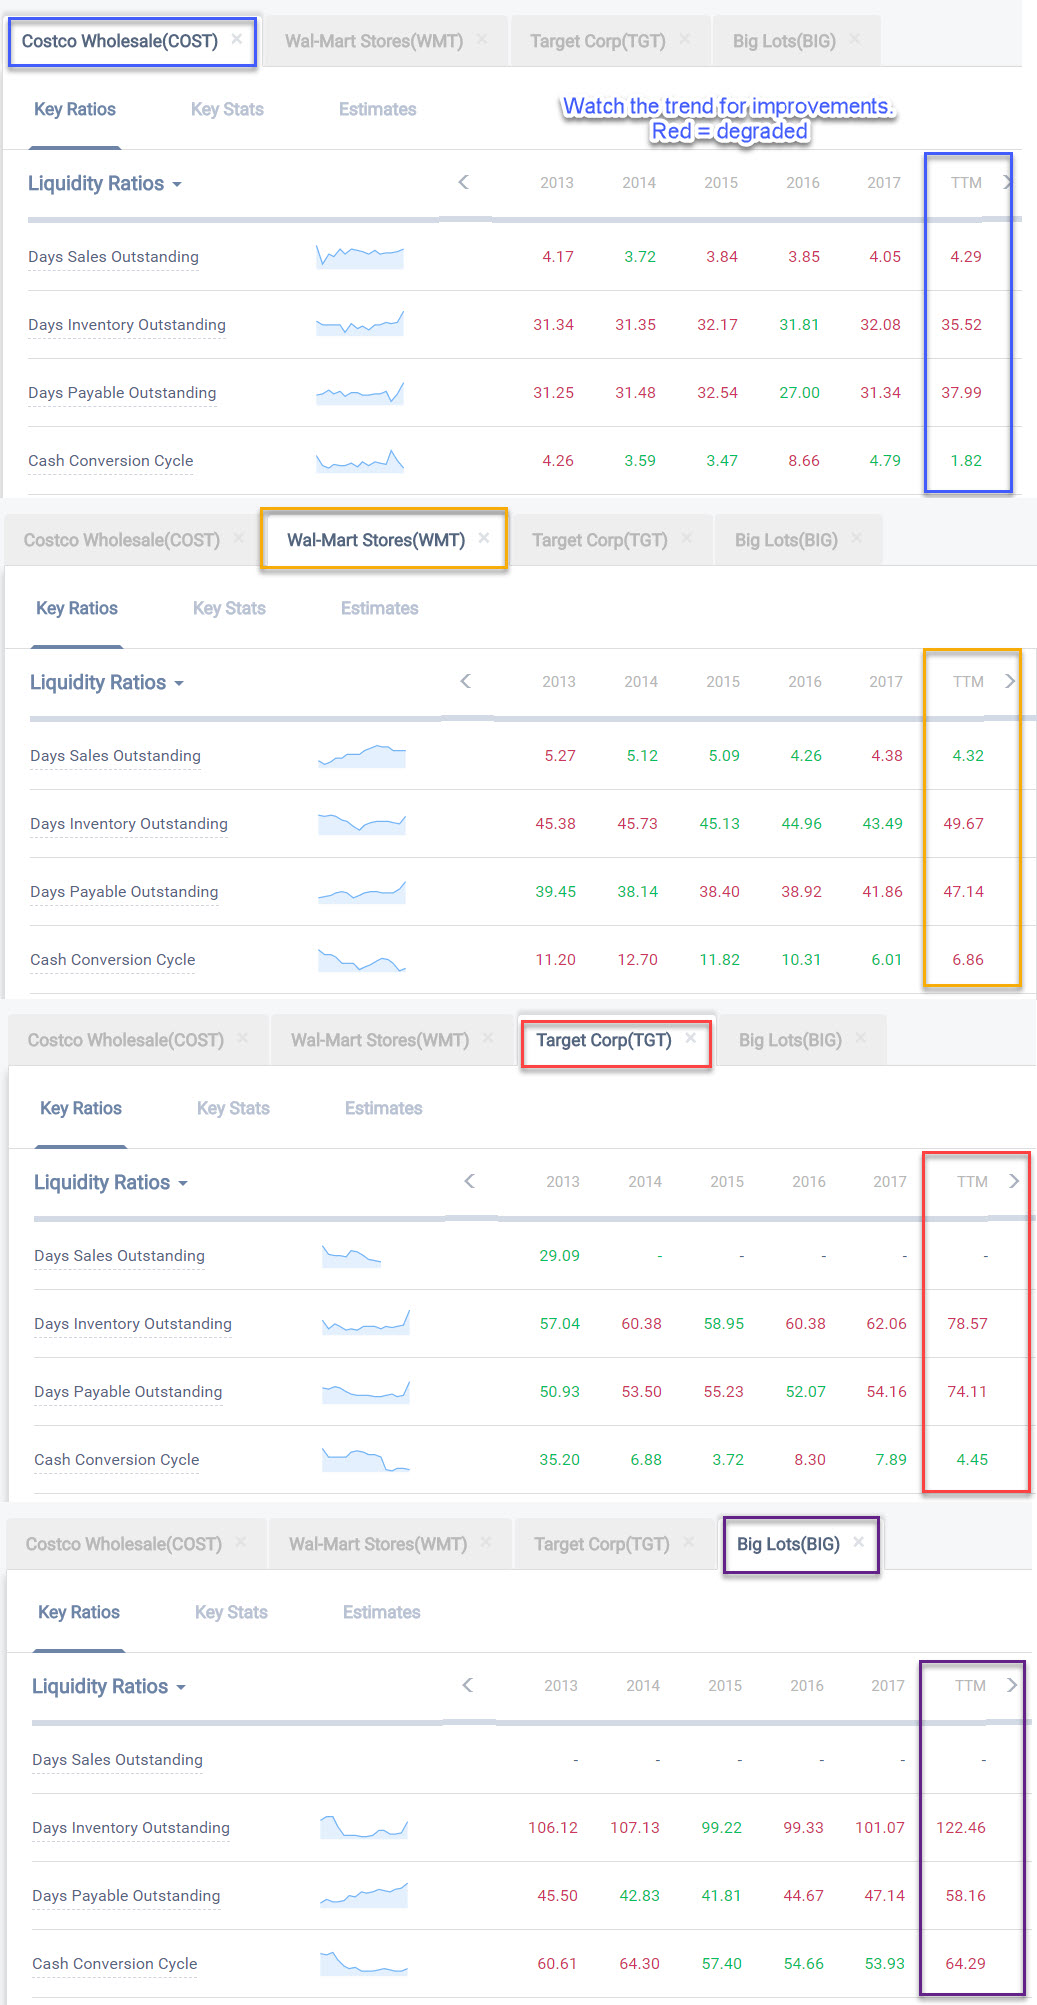
COST vs WMT vs TGT vs BIG cash conversion cycle | Source: Old School Value Key Ratios
When looking at a company on an individual basis, it’s best to look at the trend and see how it has been moving.
If the cash conversion number continues to go up, it’s a sign that business is not operating well. Because the CCC looks at the entire cycle from purchasing to sales to collections, any time the final cash conversion cycle number increases, dig in to see where the real issue is coming from.
When you look at COST vs WMT vs TGT vs BIG above, the clear winner is COST and the clear loser is BIG.
Costco is able to convert everything back into cash in 1.82 days. Operating magic for a retailer. A quicker cycle also means that they can operate at lower margins.
Case in point;
- Costco gross margins = 13%
- Walmart gross margins = 26%
- Target gross margins = 30%
- Big Lots gross margins = 40%
From this, you can see that assuming high margins is a good thing is a fallacy. Big Lots has the highest margin, but the worst cash conversion cycle. You can also see the strategy behind each company when you look at this.
- Costco strategy is to focus on high volume and sacrifice margins
- Walmart also goes for high volume but low margins
- Target is looking for a mix where it doesn’t want to overly sacrifice margins
- Big Lots focuses on high margins which is a surprise considering their product mix
How to Interpret Cash Conversion Cycle to Pick Stock Winners
An increase in Days Sales Outstanding (DSO) means that collections are not being managed properly. Customers are not paying on time or the company is extending the payment date in order to lock in a deal. Conversely, a decrease in DSO means the company is receiving payments quicker than expected.
An increase in Days Inventory Outstanding (DIO) means it is taking longer for the company to sell its inventory. The smaller the number, the quicker it is selling through inventory.
An increase in Days Payable Outstanding (DPO) is actually a good thing – unless the company is taking forever to pay because it has no cash. But technically, the longer it can delay payments or get good terms, the better.
When you put the companies side by side, there’s additional insight you can gather. Here’s my analysis.
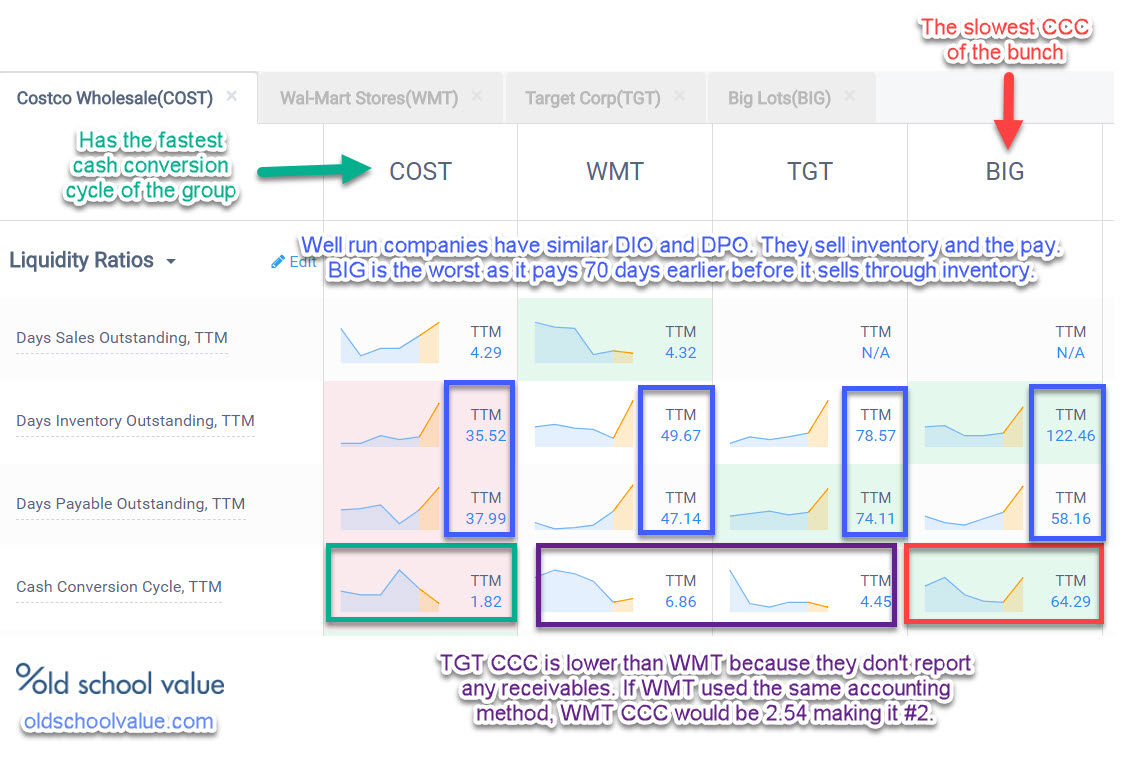
The Cash Conversion Cycle Analysis | source: Old School Value Key Ratios
Of the group, the company with the best Cash Conversion Cycle is Costco.
Worst is Big Lots.
Walmart and Target make up #2 and #3, but because Target does not report receivables as it is considered too short to make it material, there is no receivables data, therefore DSO is zero. If Walmart also decides to use similar accounting methods, their CCC would come down to 2.54 days.
Look closely at the blue highlight, and the pattern you see across well run retailers is that DIO and DPO are in a close range. Makes sense because you want to be selling and paying for inventory as close together as possible. Not like BIG where it takes them an additional 70 days to sell inventory after they have paid their bills.
Bad Cash Conversion Cycle Examples
If you compare companies where the business models are not identical, it won’t work. Although the following companies have overlapping areas of business, because they are not identical you can results like this.
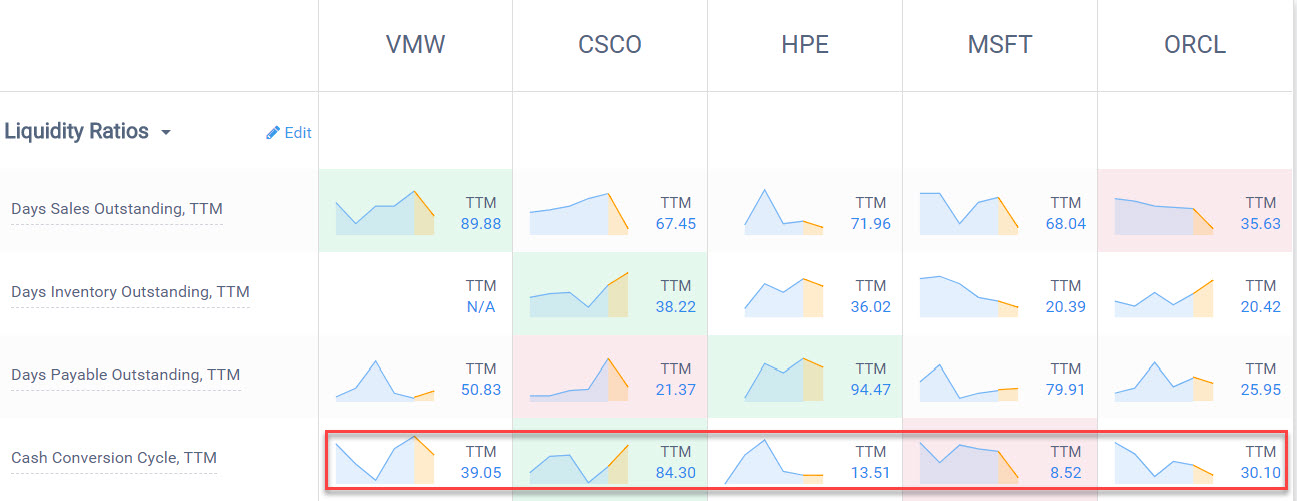
Cash Conversion Cycle Example of Different Business Models
There’s no point if you look at the numbers like this.
The best method in this scenario is to look at the companies individually by analyzing the historical trend of each DSO, DIO and DPO.
Does the Cash Conversion Cycle Affect Stock Prices?
It does not directly affect the stock price. Analysts and people do not consider this type of accounting and business analysis. I have yet to come across a stock that shot up because the cash cycle improved.
So how does this help with stock picking?

I am a better investor because I am a businessman – Warren Buffett
The CCC ratio is mainly used by business owners and accountants to better understand the business. This is the type of hidden catalyst that can help you identify winning stocks before it gets picked up by the crowd.
By being able to understand and look at the KPI’s that matter to management, you become a better investor. It’s an analysis that gives you an all-round understanding of the business as opposed to just focusing on margins and other basics on a standalone basis.
We make it easy to view at Old School Value. Go to the Key Stats feature and look at the “liquidity” group. To view it side by side, go to Compare Competitors and select “Liquidity” in the drop down.
Can You Have a Negative Cash Conversion Cycle?
Yes.
Anytime you come across a company with a negative cash conversion cycle, it means the business model receives money up front or much quicker compared to what they spend.
Insurance float is the same concept. You are receiving money and before you have to pay anything you can use the money interest free before any payments are made.
Tech companies also have it good as people pay for cost of services upfront or way in advance. If I use Amazon as an example, you can see that in the TTM, Amazon collects money in 27 days, sells through inventory in 52 days and makes payments in 112 days.
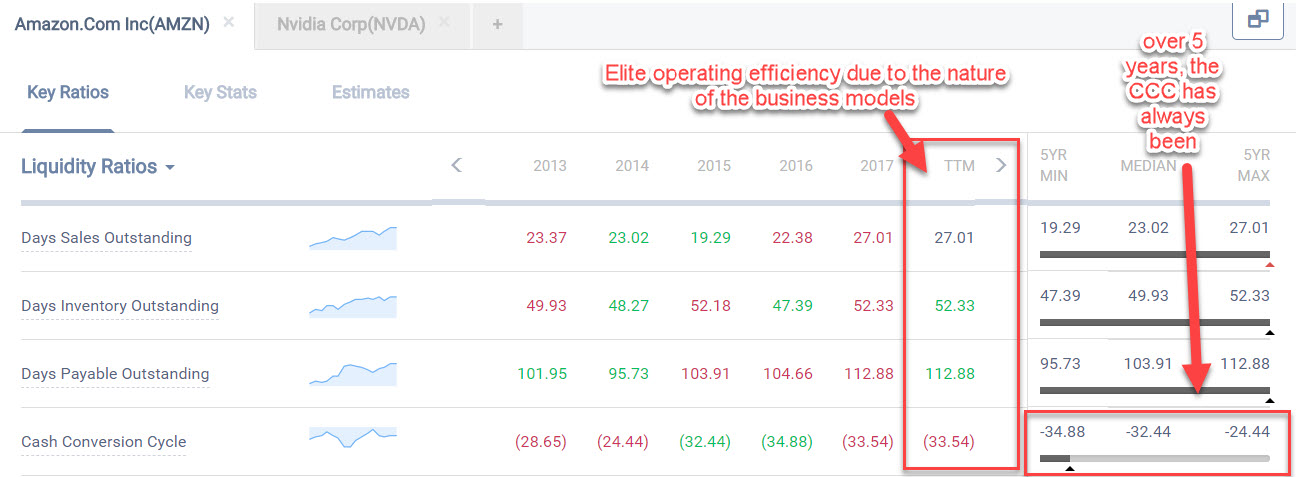
cash conversion cycle amazon
You can also screen for negative cash conversion cycle stocks with the Old School Value screener.
The types of industries that are showing up when I run the screen are healthcare, pharma, tech, utilities, and restaurants.
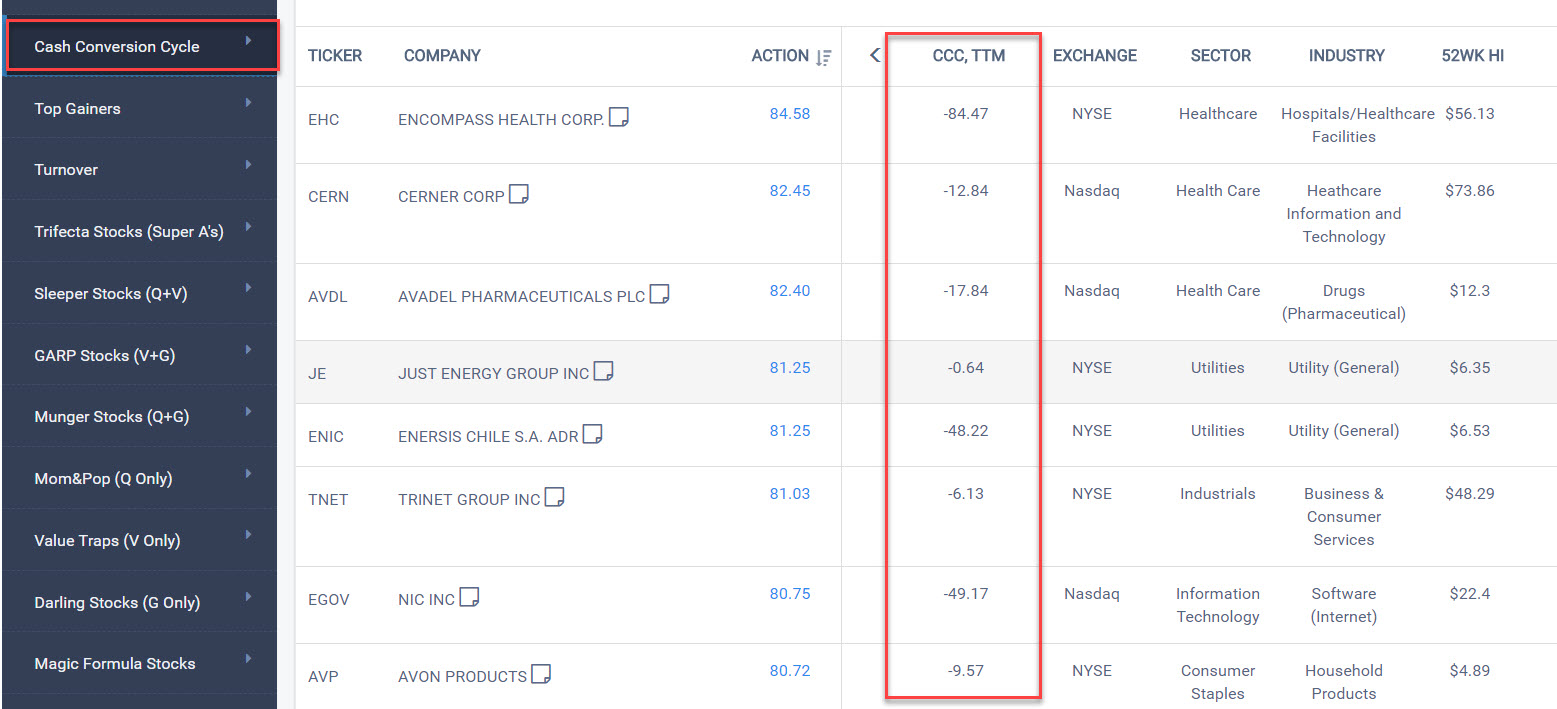
Screening for Negative Cash Conversion Cycle Stocks | source: Old School Value Screener
Summary
- Cash conversion cycles provide insight into operating efficiency and management effectiveness
- Puts other numbers like margin and cash flow into perspective
- Use to compare very close competitors
- If the business models are not very close, analyze the cash conversion cycle individually by looking at historical trends for DSO, DIO and DPO
- CCC can be negative and these are companies that are cash rich
- Cash Conversion Cycle won’t predict stock returns, but it is a key performance indicator vital to every business
Disclosure: Long WMT